LogFlux at a Glance
LogFlux is a zero-knowledge log management platform where all encryption and decryption happens on the client side – the server stores only ciphertext and cannot read your data.
Data flow: Agent collects logs → AES-256-GCM encryption on your system → Ingestor receives ciphertext over TLS → SQS queues entries → Worker writes Parquet to S3 → Client retrieves and decrypts locally with DuckDB + Grafana.
Key numbers:
| Specification | Value |
|---|---|
| Payload encryption | AES-256-GCM (authenticated) |
| Key exchange | RSA-4096 handshake |
| Ingest latency (p95) | <50 ms |
| Storage format | Apache Parquet on S3 |
| Metadata store | DynamoDB |
| Regions | EU, US, CA, AU, AP |
LogFlux has three main components: an agent that collects and encrypts logs, a cloud service that stores encrypted Parquet files, and client tools that decrypt and analyze locally.
System Architecture
The LogFlux architecture consists of three primary components:
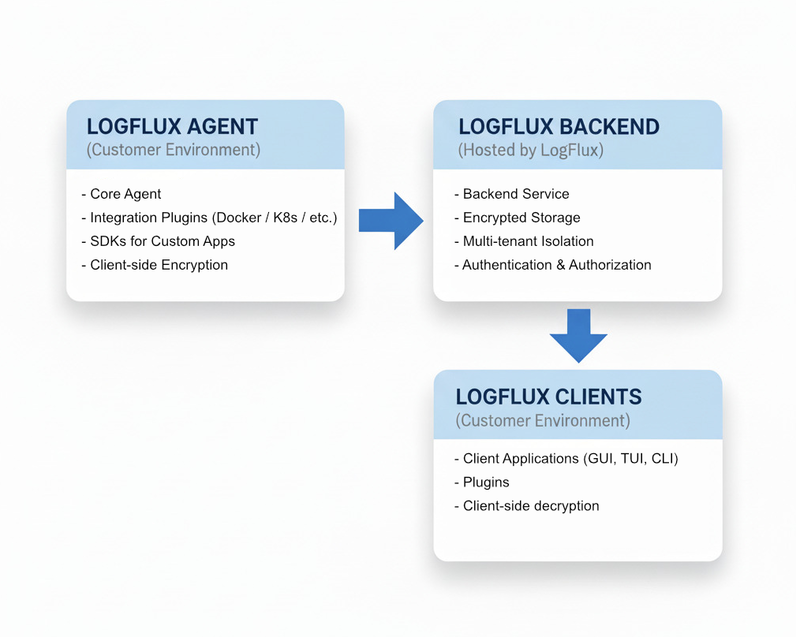
Component Overview
1. LogFlux Agent - Log Collection and Encryption Layer
The LogFlux Agent runs in your environment and is responsible for collecting logs from your applications and infrastructure, encrypting them locally, and sending them to the LogFlux Backend. It provides multiple integration options to suit different use cases:
Core Agent
- Lightweight Agent: Minimal resource footprint for production environments
- Client-side Encryption: All logs encrypted with AES-256-GCM before transmission
- Resilient Architecture: Built-in retry logic and local buffering
- Multi-tenant Support: Secure isolation between different applications
Integration Plugins
The agent supports various integration plugins for common infrastructure components:
- Docker: Collect logs from Docker containers
- Kubernetes: Native Kubernetes log collection
- Nginx: Web server access and error logs
- systemd: System service logs
- File-based: Monitor log files and directories
SDKs for Custom Applications
Native libraries for integrating LogFlux directly into your applications:
- Go SDK: Native Go integration with structured logging
- Python SDK: Python logging handlers and async support
- JavaScript SDK: Node.js and browser-compatible logging
- Java SDK: Enterprise Java logging integration
Key Features
- Zero-trust Architecture: Encryption happens on your systems before transmission
- Flexible Integration: Choose plugins, SDKs, or direct API integration
- Batching and Compression: Efficient log transmission
- Local Buffering: Continue logging during network outages
- Configurable Retention: Local buffering with configurable limits
2. LogFlux Backend - Hosted Storage and Processing
The LogFlux Backend is fully managed by LogFlux and handles encrypted log storage, indexing, and retrieval. All data remains encrypted at rest - only your analysis tools can decrypt it.
Ingestor Service
- High-Performance Ingestion: Handles thousands of encrypted log entries per second
- Multi-tenant Isolation: Complete data separation between customers
- API Key Authentication: Secure, simple authentication without tokens
- Geographic Distribution: Available in multiple regions for data residency
- Rate Limiting and DDoS Protection: Enterprise-grade infrastructure protection
Backend Service
- Encrypted Storage: Logs stored encrypted - we cannot read your data
- Fast Indexing: Efficient search capabilities on encrypted metadata
- Retention Management: Automatic data lifecycle management
- Query Engine: High-performance log retrieval and filtering
- Multi-region Support: Choose your preferred data residency region
Benefits of Managed Backend
- Zero Maintenance: We handle all infrastructure, scaling, and operations
- High Availability: Built-in redundancy with 99.9% uptime SLA
- Compliance Ready: SOC 2, GDPR compliant with data residency options
- Scalable: Automatically scales with your log volume
- Cost-effective: Pay only for what you use with transparent pricing
3. Log Analysis Tools
LogFlux provides log analysis through industry-standard tools and command-line interfaces. All decryption happens locally on your systems - LogFlux never has access to your plaintext logs.
Grafana Integration (Recommended)
- Native Grafana Datasource: LogFlux plugin for Grafana dashboards
- Industry Standard UI: Use dashboards you already know and trust
- Rich Visualizations: Charts, graphs, and monitoring dashboards
- Real-time Monitoring: Live log streaming with customizable alerts
- No Proprietary UI: No need to learn new interfaces
Command Line Interface (CLI)
- Powerful CLI Tool: Perfect for automation, scripting, and DevOps workflows
- Complex Queries: Advanced search with filters, time ranges, and regex
- Integration Ready: Easy integration with existing tools and pipelines
- Batch Operations: Bulk log analysis and processing capabilities
| |
Custom Integrations
- REST API: Build custom analysis tools and integrations
- SDK Support: Integrate LogFlux into existing monitoring systems
- Webhook Support: Real-time notifications and alerting
Data Flow
Understanding how data flows through LogFlux helps in optimizing your logging strategy:
- Log Generation: Your applications and infrastructure generate log entries
- Collection: The LogFlux Agent captures logs using plugins or SDKs
- Client-side Encryption: Logs are encrypted with AES-256-GCM in your environment
- Secure Transmission: Encrypted logs are sent to the LogFlux Backend over TLS
- Encrypted Storage: The Backend stores logs without being able to decrypt them
- Retrieval: LogFlux CLI or Grafana query and retrieve encrypted logs from the Backend
- Client-side Decryption: Tools decrypt logs locally for analysis and viewing
- Analysis: Use Grafana dashboards or CLI tools to search, filter, and analyze your decrypted logs
Zero-Knowledge Architecture
LogFlux follows a zero-knowledge architecture where:
- Encryption keys never leave your environment
- LogFlux cannot decrypt your log data
- Only your analysis tools can read your logs
- End-to-end encryption from agent to analysis tools
Security Architecture
LogFlux implements a zero-knowledge, end-to-end encryption architecture designed to ensure maximum security and privacy:
Zero-Knowledge Architecture
- Client-side Encryption: All logs encrypted with AES-256-GCM in your environment before transmission
- Private Key Management: Encryption keys never leave your systems
- No Plaintext Access: LogFlux cannot decrypt or read your log data
- End-to-End Security: Data remains encrypted from agent to analysis tools
Authentication & Authorization
- API Key Authentication: Unique keys for each application with HMAC signatures
- Region-Prefixed Keys: API keys and PATs include a region prefix (e.g.,
eu-lf_...) for automatic endpoint discovery - Scoped Access: Keys tied to specific customers and applications
- Personal Access Tokens (PATs): Secure tokens for CLI and Grafana authentication
- Multi-tenant Isolation: Complete logical and cryptographic separation between customers
Encryption Implementation
Agent-Side Encryption
- AES-256-GCM: Industry-standard authenticated encryption
- Unique Keys: Separate encryption keys per application
- Key Derivation: Secure key derivation from customer secrets
- Authenticated Data: Encryption includes authentication tags to prevent tampering
Tool-Side Decryption
- Local Decryption: All decryption happens on your systems
- Key Management: CLI and Grafana manage their own decryption keys
- Secure Storage: Keys stored securely on your systems
- No Key Transmission: Keys never sent over the network
Data Protection
- Encryption in Transit: TLS 1.3 for all API communications
- Encrypted at Rest: All stored logs remain encrypted with customer keys
- Data Isolation: Complete cryptographic separation between customers
- Customer-Specific URLs: Dedicated subdomains for enhanced isolation
- Access Logging: Comprehensive audit trail of all encrypted data access
Service Discovery
LogFlux provides two discovery mechanisms:
- Static Discovery: Unauthenticated, per-region endpoints at
discover.{region}.logflux.io(EU, US, CA, AU, AP). SDKs with region-prefixed keys automatically resolve the correct discovery URL. - Authenticated Discovery: Full discovery via the API Service (
/v1/discovery) returning user info, capabilities, and rate limits.
SDKs try static discovery first for region-prefixed keys, then fall back to authenticated discovery.
Compliance & Privacy
- Zero-Knowledge Provider: We cannot access your log content
- Data Residency: Choose between EU, US, CA, AU, and AP regions
- GDPR Compliant: Right to deletion, data portability, and privacy by design
- SOC 2 Type II: Enterprise security controls and audit compliance
- HIPAA Compatible: Suitable for healthcare and sensitive data logging
- Data Sovereignty: Your keys, your data, your control
Scalability & Performance
LogFlux is built to scale with your needs:
Horizontal Scaling
- Collectors: Deploy as many collectors as needed
- Ingestors: Automatically scale based on load
- Storage: Virtually unlimited log storage
Performance Optimization
- Compression: Logs are compressed for efficient storage
- Indexing: Smart indexing for sub-second search results
- Caching: Intelligent caching for frequently accessed data
- Load Balancing: Automatic distribution across multiple servers
Best Practices
Agent Deployment
- Choose the Right Integration: Use plugins for infrastructure, SDKs for applications
- Secure Key Management: Store encryption keys securely and rotate them regularly
- Configure Local Buffering: Size buffers appropriately for your log volume
- Monitor Agent Health: Track metrics like encryption performance and transmission rates
- Use Structured Logging: JSON format enables better filtering and analysis
Security Best Practices
- Key Rotation: Regularly rotate encryption keys and API keys
- Least Privilege: Use separate API keys per application with minimal required permissions
- Secure Key Storage: Store encryption secrets in secure key management systems
- Network Security: Use private networks and firewalls to protect agent communications
- Audit Access: Regularly review who has access to encryption keys and analysis tools
Analysis Tool Usage
- Secure Tool Deployment: Deploy CLI and Grafana in secure environments with proper access controls
- Local Key Storage: Use secure storage for decryption keys (OS keychain, vault systems)
- Save Common Queries: Create saved searches and Grafana dashboards for frequent investigations
- Time-based Filtering: Use time ranges to improve query performance
- Export Compliance Data: Export critical logs for regulatory compliance and auditing
Performance Optimization
- Batch Log Transmission: Configure appropriate batch sizes for your network
- Compression: Enable compression for large log volumes
- Regional Deployment: Choose backend regions close to your infrastructure
- Indexing Strategy: Structure logs to optimize search performance
- Tool Caching: Use caching in CLI and Grafana for frequently accessed log data
Getting Started
Ready to implement LogFlux’s zero-knowledge logging in your infrastructure?
- Create an Account: Get your API keys and set up encryption
- Deploy LogFlux Agent: Install the agent with plugins or SDKs
- Configure Encryption: Set up client-side encryption keys
- Install LogFlux CLI: Deploy CLI for log analysis and automation
Next Steps
- API Reference: Detailed API documentation for agent and client integration
- SDKs Documentation: Language-specific guides for custom application integration
- Security Best Practices: Secure your zero-knowledge logging infrastructure